Do we know that 70% of our sensory receptors are located in the eyes? It takes only 10 milliseconds for a human brain to understand a visual observation and about 150 milliseconds to process the information. Some might wonder how this data and information are related to infographics for marketing and why we should use them.
Based on research and findings and mostly common experience has led us to believe that a visual representation of complex data will always be easier to understand than texts and that’s what infographics is all about. That’s why small and large businesses alike have been using infographics as a way to convey information and do marketing for a long time ago.
In this age of information and technology, human brains seek for an easier and faster solution to comprehend information that is being provided to them. This is what the businesses are leveraging to establish brand authority in their customer’s minds using infographics.
Compared to generic blog content (which is also very important), infographics combine vibrant visuals along with minimal text which is very eye-catching and easy to process. In our current time, statistical data shows us that only 28% of the words are read on a webpage on an average visit.
And it is natural because most visitors don’t bother with every detailed information provided. Infographics have proved to provide us data and information more easily and quickly. It’s more engaging than regular text-based content. 50% of our brains are always visual processing of information and that’s why we give importance to infographics for marketing.
What is Infographic and Infographics for Marketing?
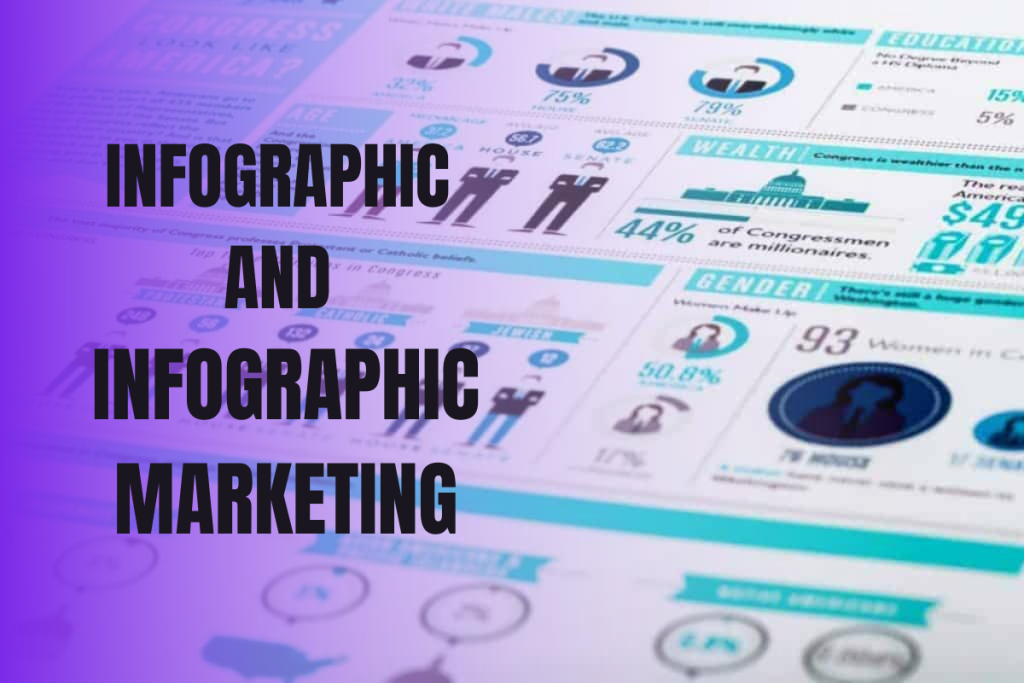
Infographics are the visual representation of data, information, and text in a form that is more engaging to the audience. We often find large detailed text boring and data/information too complex to understand.
Infographics help to break down these issues into a more compelling and simplistic manner so that the individual who is viewing the infographic can easily understand and interpret the information provided through the infographic.
In infographics, the creator uses various forms of logos, visual icons, vibrant images, minimal texts, and other forms of creative designs to make a quality infographic. The purpose of infographics is to educate the audience about a topic in a more visually engaging manner like a large image.
Infographics for marketing is a marketing method where a company or a business incorporates infographics in its marketing strategy for various purposes. Infographics for marketing has become a popular content marketing strategy nowadays. In the content marketing universe, infographics have become an effective way to reach out to their audience and increase their brand visibility.
Infographics for marketing helps to convey any message or information to the audience in a more dynamic and visual format. Due to its engaging format, audiences are more hooked in this type of content. It can also help to boost the SEO as well. Infographic marketing helps to differentiate content and helps search engines to crawl on the web pages much easier.
Are infographics good for SEO and link building?
Search engines like Google are unable to crawl or analyze visual data and information. That’s why the majority of the infographics accompany an inside and out article or blog entry planned for developing the data introduced in the infographic. Besides giving a point by point clarifications, these articles additionally support SEO. The search engine behavior with text, infographics are demonstrated particularly helpful for inbound connection age and social sharing, which additionally makes them significant for search motor streamlining. General practices for expanding the search and social reach of infographics incorporate a mix of corresponding online networking showcasing and discussion advancements.
How to Create the Best Infographic?
1. Crack a complex problem
First and foremost, creating a great infographic requires something to be explained and answered. The best way to approach an infographic is to solve a burning problem or crack a complex case. The infographic should be a visual representation of the relevant problem or issue. In this case, you have to become the reader and think about how do you want to view the problem.
Then look into the problem from a wider angle and find connections among your audience. For example, your audience wants to know how to solve the Facebook Ads inconsistency problem. The key to solving inconsistency is always testing new creative ideas and changing your angle with the ads. You can represent this solution in the form of an infographic.
As the problem can be a bit complicated, an infographic will be easier to understand and learn to solve the issue themselves. As you are creating the infographic for marketing with a suitable template, try to fit in more data and information that your audience will find helpful and it will make you an authoritative figure in the market.
2. Include Legitimate Facts and Statistics
One of the reasons why infographics are so popular is because how it uses a minimal amount of text and covers it with data information and images. Since the statistical data is very important, you need to ensure if it’s legitimate or not. The wrong data may cause the audience to lose trust in your brand.
The best way to build credibility is always by providing factual data and information. Try to include market research data, sales reports, and other factual information. Depending on the subject of the infographic, numerous online assets can give you valuable information.
For statistical information about the economic and financial situation of the world, World Bank has a bounty of data. In case you’re searching for insights about specific geographic districts or urban areas, GeoBase is the spot to go. Google Trends is incredible for showing the developing enthusiasm for a specific subject.
The Census has some truly intriguing information about the number of inhabitants in America. For discovering proof from peer-looked into diaries and other insightful writing, Google Scholar is enthusiastically suggested. When you will be citing factual data and information, make sure that guarantee from acceptable sources.
Proof from peer-audited diaries is constantly paid attention to more than proof from a Wikipedia article. Continuously refer to your sources in the footer of the infographic to show that you aren’t creating anything.
3. Present from a different perspective
This is how you make quality infographics for marketing. You will find thousands of infographics on the internet about a subject or a specific topic. You will have to differentiate your one amongst thousands of others. The best way to do this is by changing the perspective or representing it from a different angle. Instead of simply putting out facts and information on a chart, add more value to it.
For example, there was a medical company that made an infographic on the importance of malaria vaccination. They thought that people will simply ignore if they put statistics like health benefits and such. Instead, they made an infographic on the deadliest insects and animals and mosquitos were at the top.
The reason it caught the attention of the audience was because of its comparison state. It was very engaging and people it took it seriously because millions of people were dying from mosquitos than sharks! By presenting what you want to present differently, you can make a difference. However, make sure that the purpose of the infographic does not change its meaning.
4. Find the origin stories
There is always an origin or a starting point in every story we hear. It’s the same business case. There is always an origin to something. For example, your brand likes to work with a holiday niche. So, it’s natural to create products for any upcoming holiday like Christmas or Valentine’s Day.
You can easily create a timeline infographic for any particular holiday and post it for your audience. What makes these infographics popular is people’s curiosity to find meaning in the backstory of any event.
And it’s not just for holidays, you can do an origin infographic for any mentionable topic that had a proper beginning. For example, any valuable person or any industry. You can easily spark the curiosity of your audience and make them more engaged in your content.
5. Find extreme cases
This is another type of infographic that sparks curiosity in people. It’s somehow similar to tracing an origin story. Extreme cases or these anomalies are often wiped out from reviews since they can vigorously negatively impact information and tilt results. For example, you find a survey on the customers that visit a specific restaurant.
On an average day, you might find that around 100 customers each day. However, you also find that on a particular day of the month, more than 500 customers visit the restaurant. Now there is your anomaly or outlier that can be used as a special story for your infographic.
Conclusion
Creating a single infographic takes time and effort and especially one’s creativity. An infographic you might personally find amazing might not even click with your audience. That’s why market research is essential to understand what your audience wants and therefore create infographics accordingly.
The infographics that shine are based on what I discussed above along with how relevant and relatable it feels to the audience. Never create infographic juts for the sole purpose of making it. Add more value to it and create something that will sync with your audience.